UK Train Traveling Web Dashboard
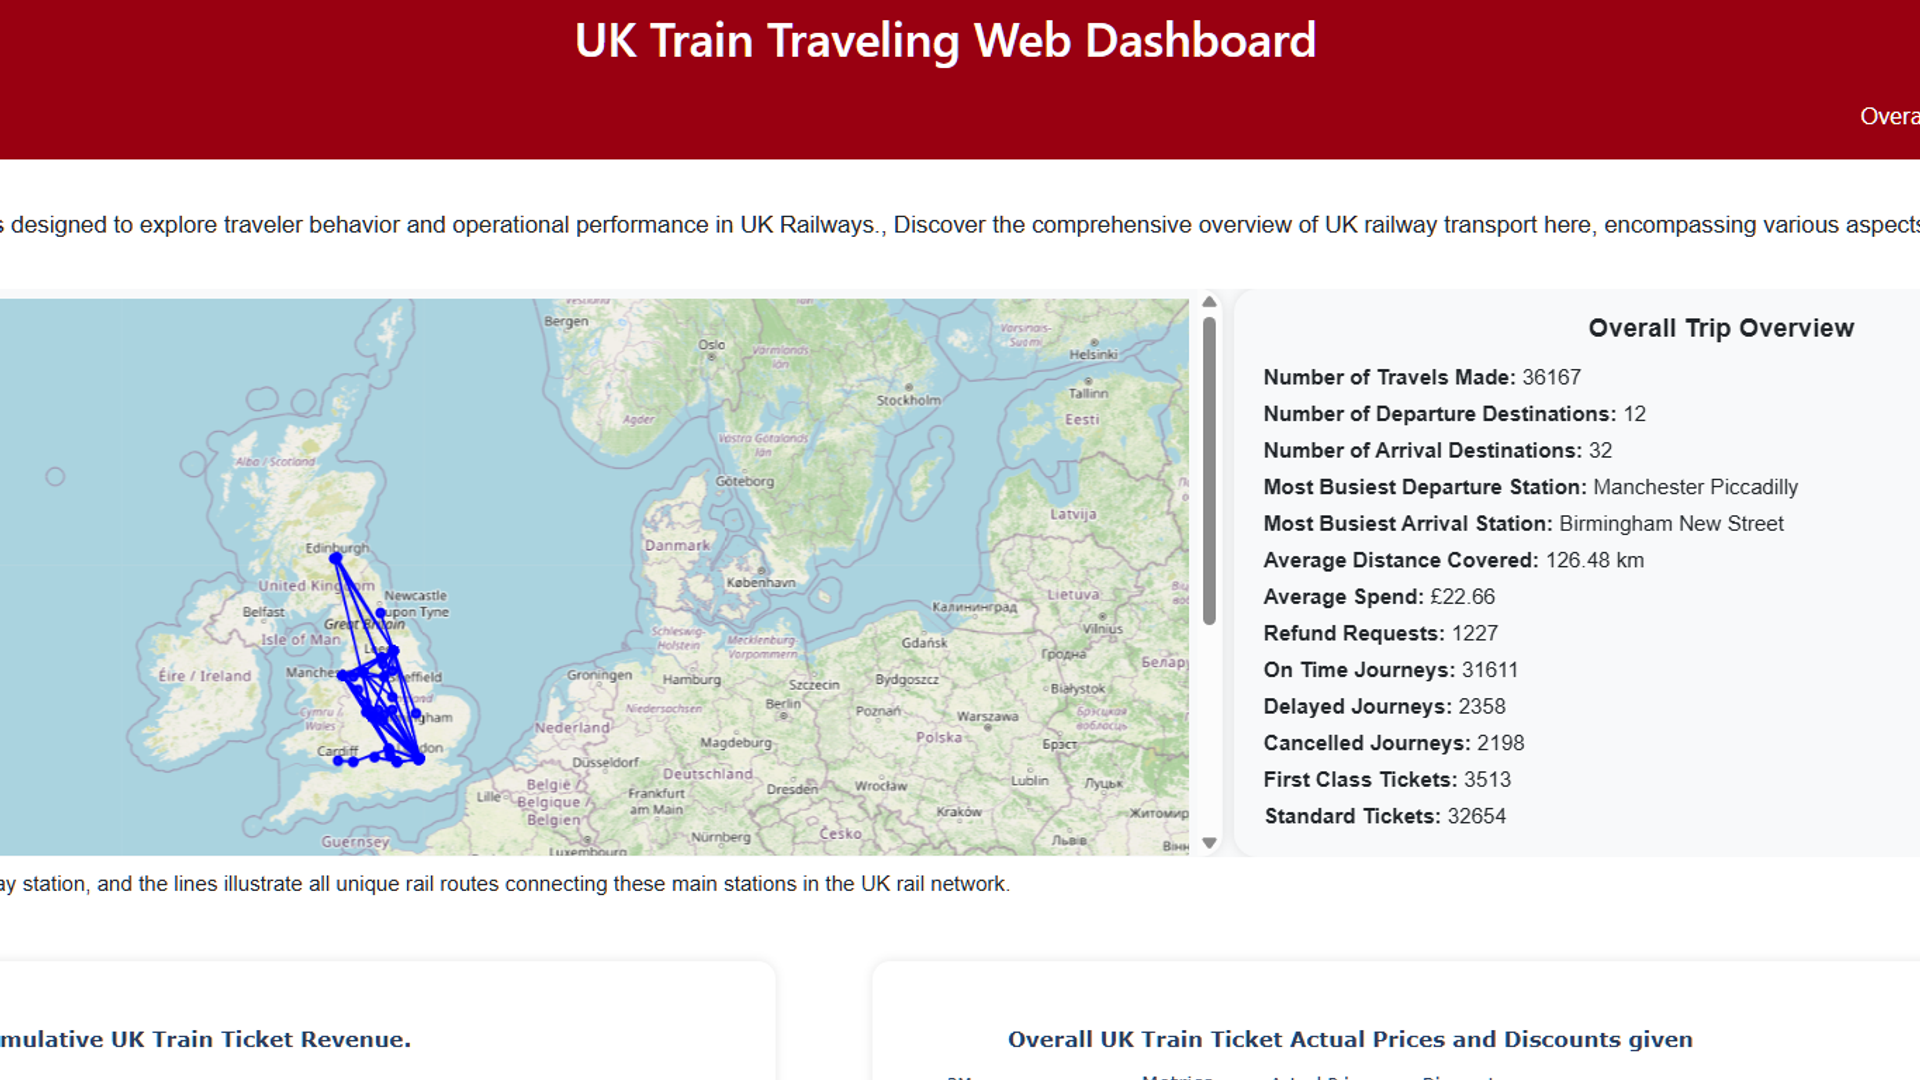
UK rail travel generates vast amounts of transactional data - ticket purchases, journey statuses, delays, refunds - but this data is rarely presented in an accessible, exploratory format. This project transforms raw UK Railways data into a fully interactive Dash web application with 11 chart types covering pricing trends, delay reasons, ticket class distributions, payment methods, and active station hours. Users can filter all charts simultaneously by departure station, arrival station, and day of the week, and view routes on an interactive Folium map. The app is containerized with Docker and deployed on Google Cloud Run, with accompanying Jupyter Notebooks covering EDA and ML-based delay prediction.
🎯 The Challenge
Maven Analytics provided a UK Railways dataset containing transactional travel data including ticket purchases, journey statuses, delays, and refunds. While the raw data contained rich information, it existed only as flat files with no analytical interface. The challenge was to transform this dataset into a flexible, multi-dimensional self-service tool that could answer route-level business questions interactively - things like which routes have the highest delay rates, which ticket types are most refunded, and how pricing varies over time - without requiring any coding from the end user.
⚙️ The Action
- Sourced and cleaned UK Railways travel dataset covering transactions, journey statuses, delays, ticket types, and payment methods.
- Designed a multi-filter Dash layout where departure station, arrival station, and day of week dynamically update all 11 charts simultaneously.
- Implemented 11 distinct visualisation types including line charts (pricing trends, discount analysis), bar charts (active hours, payment methods, ticket types, refunds), sunburst charts (purchase distribution by type/payment/status), pie charts (journey status, delay reasons, ticket class), and a Folium geographic map.
- Developed Jupyter Notebooks for EDA and delay prediction modelling alongside the dashboard.
- Containerised the full app with Docker and deployed to Google Cloud Run with public unauthenticated access.
- Configured GCP IAM service accounts and Artifact Registry for a clean CI/CD-style deployment pipeline.
📊 The Impact
- Live public dashboard serving interactive UK rail analytics to any user without installation or login
- 11 visualisations covering the full operational picture from pricing to refunds to delay root causes
- Route-level filtering enables granular, actionable insight - e.g. identifying which specific routes have the highest delay rates or lowest ticket utilisation
- Deployment on Google Cloud Run ensures the app scales automatically with zero infrastructure management
- Demonstrates a repeatable Docker → GCP Cloud Run deployment workflow applicable to any Python data application